Bitcoin, the pioneering cryptocurrency, finds itself in a precarious balance between buying and selling pressures as it traverses the market landscape. This state of equilibrium has engendered a notable degree of uncertainty regarding its future price trajectory. Unlike the highly volatile price movements that characterized earlier phases, Bitcoin is currently engulfed in a period of modest fluctuations. This stagnation calls for vigorous trading activity to illuminate the path forward, but thus far, the market exhibits signs of lethargy.
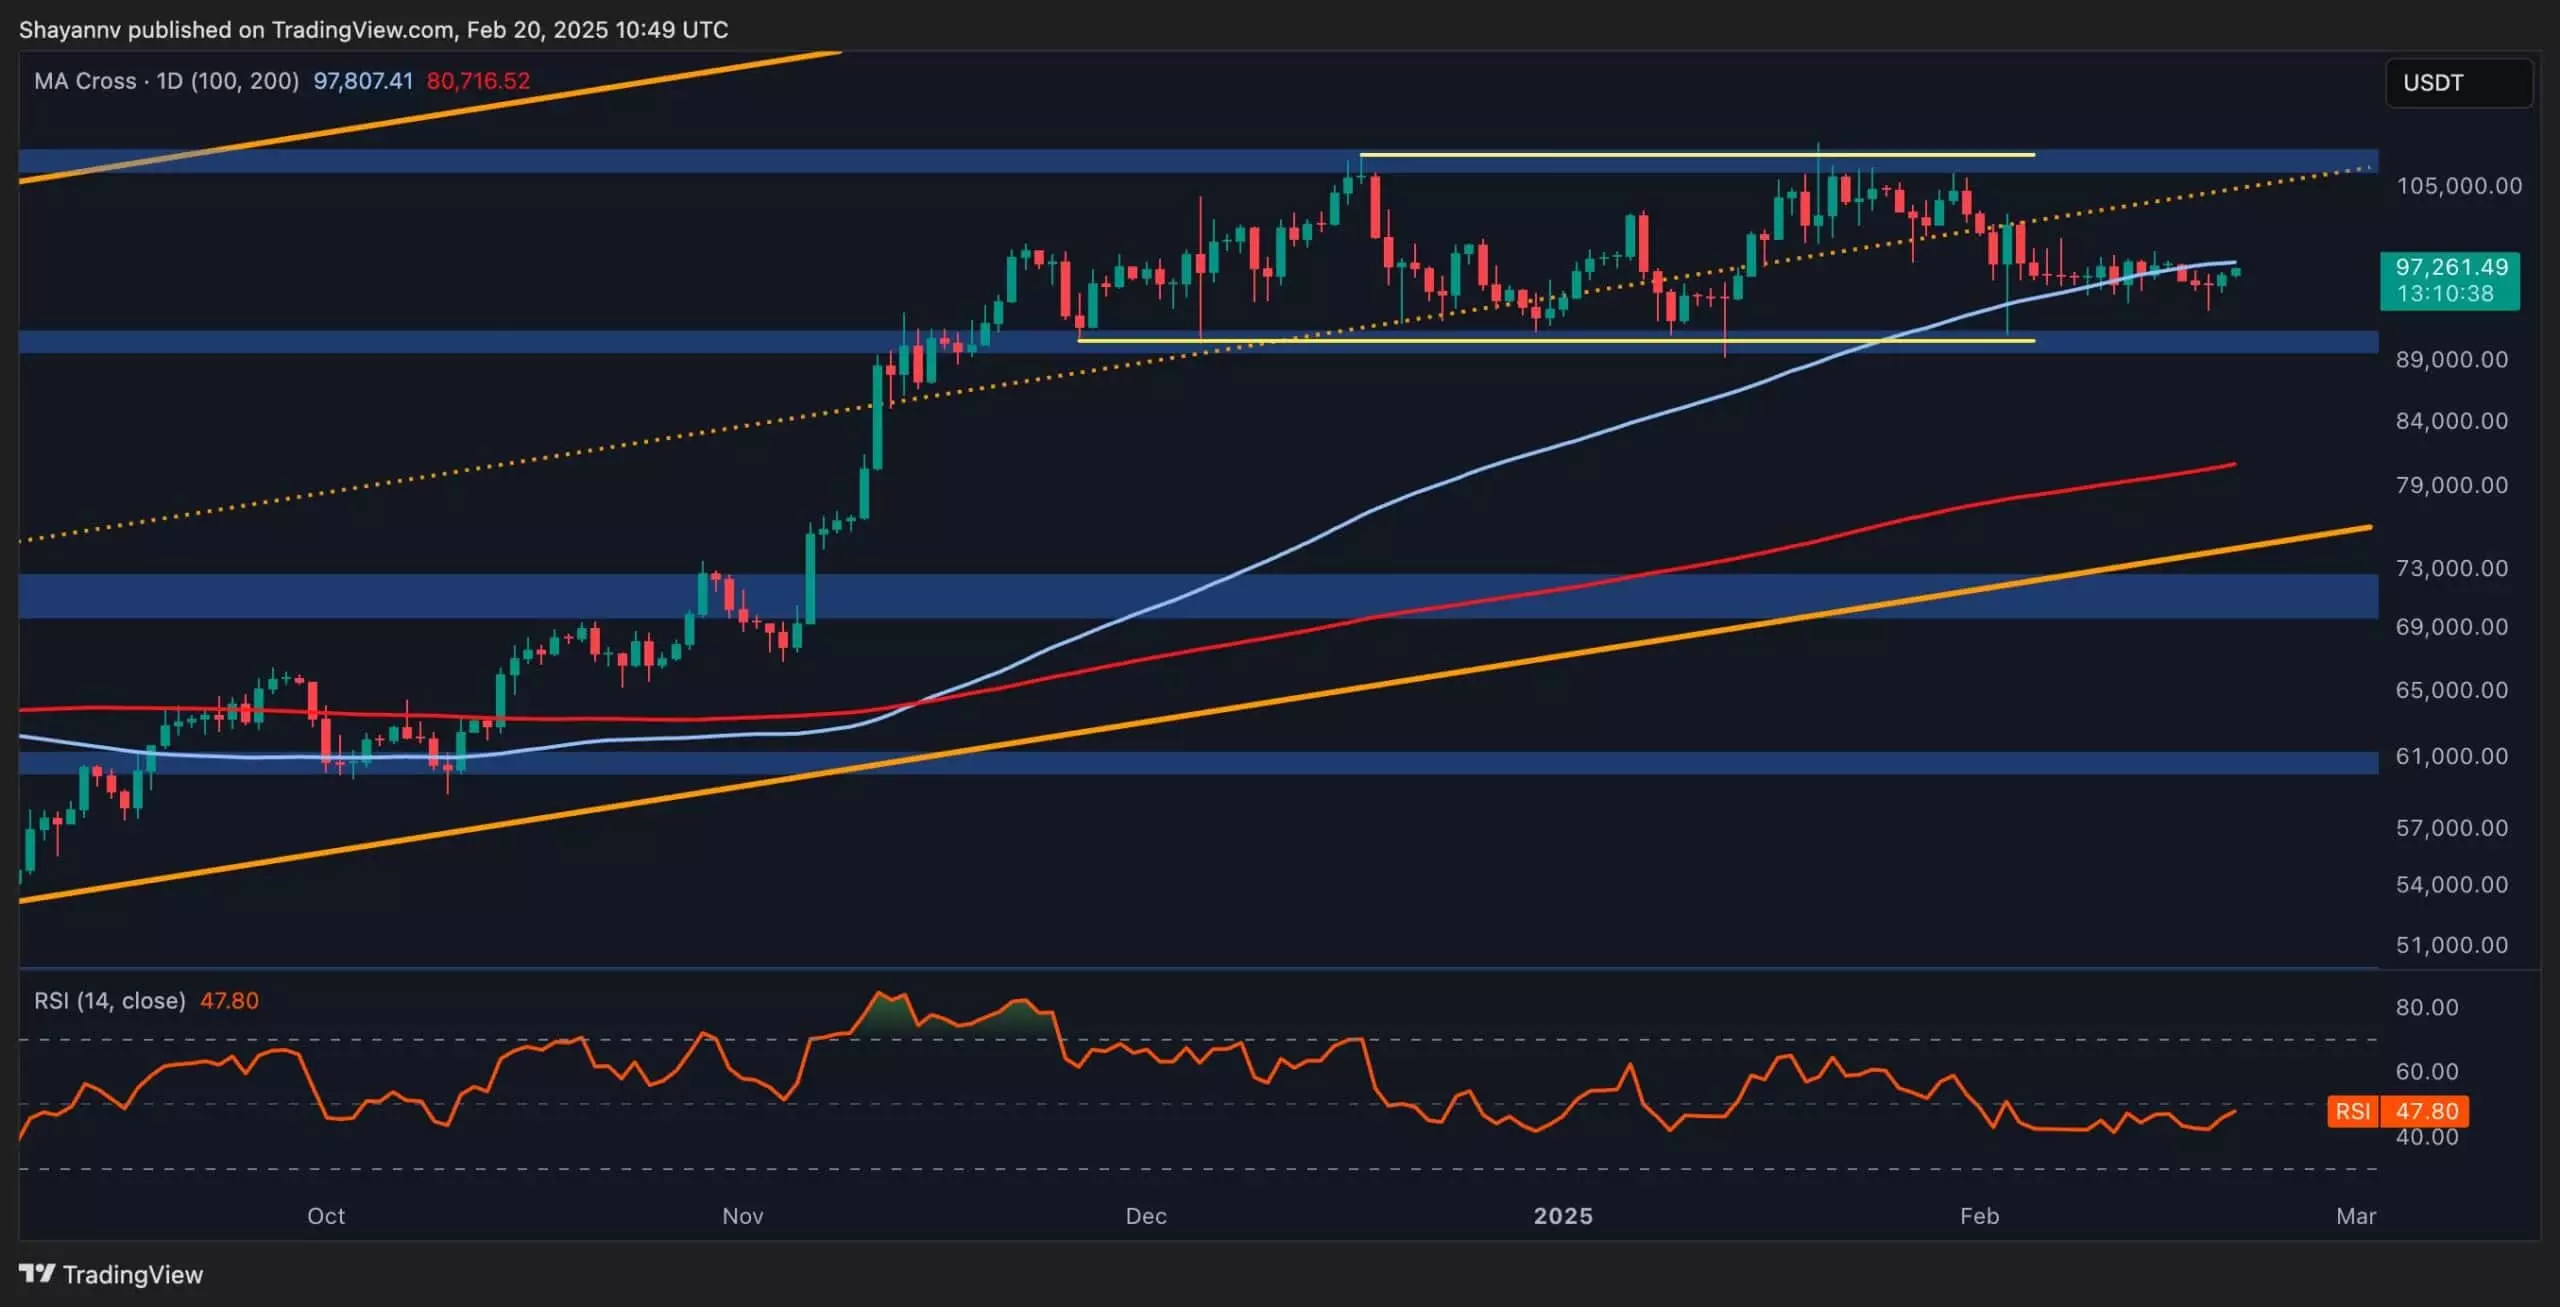
Recent analysis indicates an alarming lack of sufficient trading activity across both spot and perpetual markets, which has led to an uncharacteristic sideways movement in Bitcoin’s price. A glaring indicator of this inertia is the relative strength index (RSI), which hovers around the neutral 50 mark—signifying a standoff between bulls and bears. The current sentiment is not only marked by uncertainty but also by a palpable sense of indecision among traders, hindering any firm commitment to engage in the market.
For Bitcoin to break free from this stagnation and forge a clear directional trend, a significant increase in trading volume, along with shifting supply and demand dynamics, is paramount. Market participants are closely watching key support levels, particularly the $90,000 threshold, which is pivotal for future movements. The interplay between demand within this region and existing selling pressure will play a crucial role in Bitcoin’s fate in the coming days.
Analysis of the 4-hour timeframe suggests the emergence of a robust support zone between $92,500 and $94,300, referred to as the fair value gap. This segment of the chart has shown resilience, repeatedly thwarting sellers’ attempts to push prices lower. This area is not only characterized by intense buyer interest but also aligns with significant technical indicators—namely, the lower boundary of the ascending wedge pattern and the lower trendline of a short-term bullish flag.
The implications of these observations are profound: if Bitcoin’s price can sustain itself within this support range, it may initiate a robust buying frenzy leading towards the upper boundary of the bullish flag, potentially reaching the $98,000 mark. Furthermore, the aspirational target of $108,000 signals the market’s overarching bullish sentiment, conditional upon a solid defense of existing support levels.
While the current price action offers little in terms of concrete direction, delving deeper into the mechanics of the futures market reveals intriguing insights. Recent trends show a marked increase in open interest for perpetual futures contracts on centralized exchanges, indicating a growing influx of speculators and traders. This rise in open interest suggests that traders are positioning themselves for future price movements, hinting at an impending breakout.
However, predicting the direction of this potential breakout remains challenging without further empirical data. As we advance, traders must remain vigilant, closely monitoring market dynamics and trading volumes to ascertain Bitcoin’s trajectory. Ultimately, understanding these underlying variables can guide traders in making informed decisions in this climate of uncertainty. The road ahead for Bitcoin is undoubtedly complex, yet analysis and adaptability can unlock vast opportunities.
Leave a Reply