Bitcoin has found itself in a precarious position recently, with its price oscillating within a narrow range. This stagnation poses a significant challenge for traders and investors, as it remains unclear whether Bitcoin is gearing up for a recovery or bracing for a more profound correction. The determination of whether this phase reflects accumulation—a buildup of buying interest—or distribution—settling of holdings—is crucial in forecasting the market’s next trajectory. As analysts delve deeper into the charts, the implications of these movements become increasingly evident.
Technical Analysis: Key Indicators to Watch
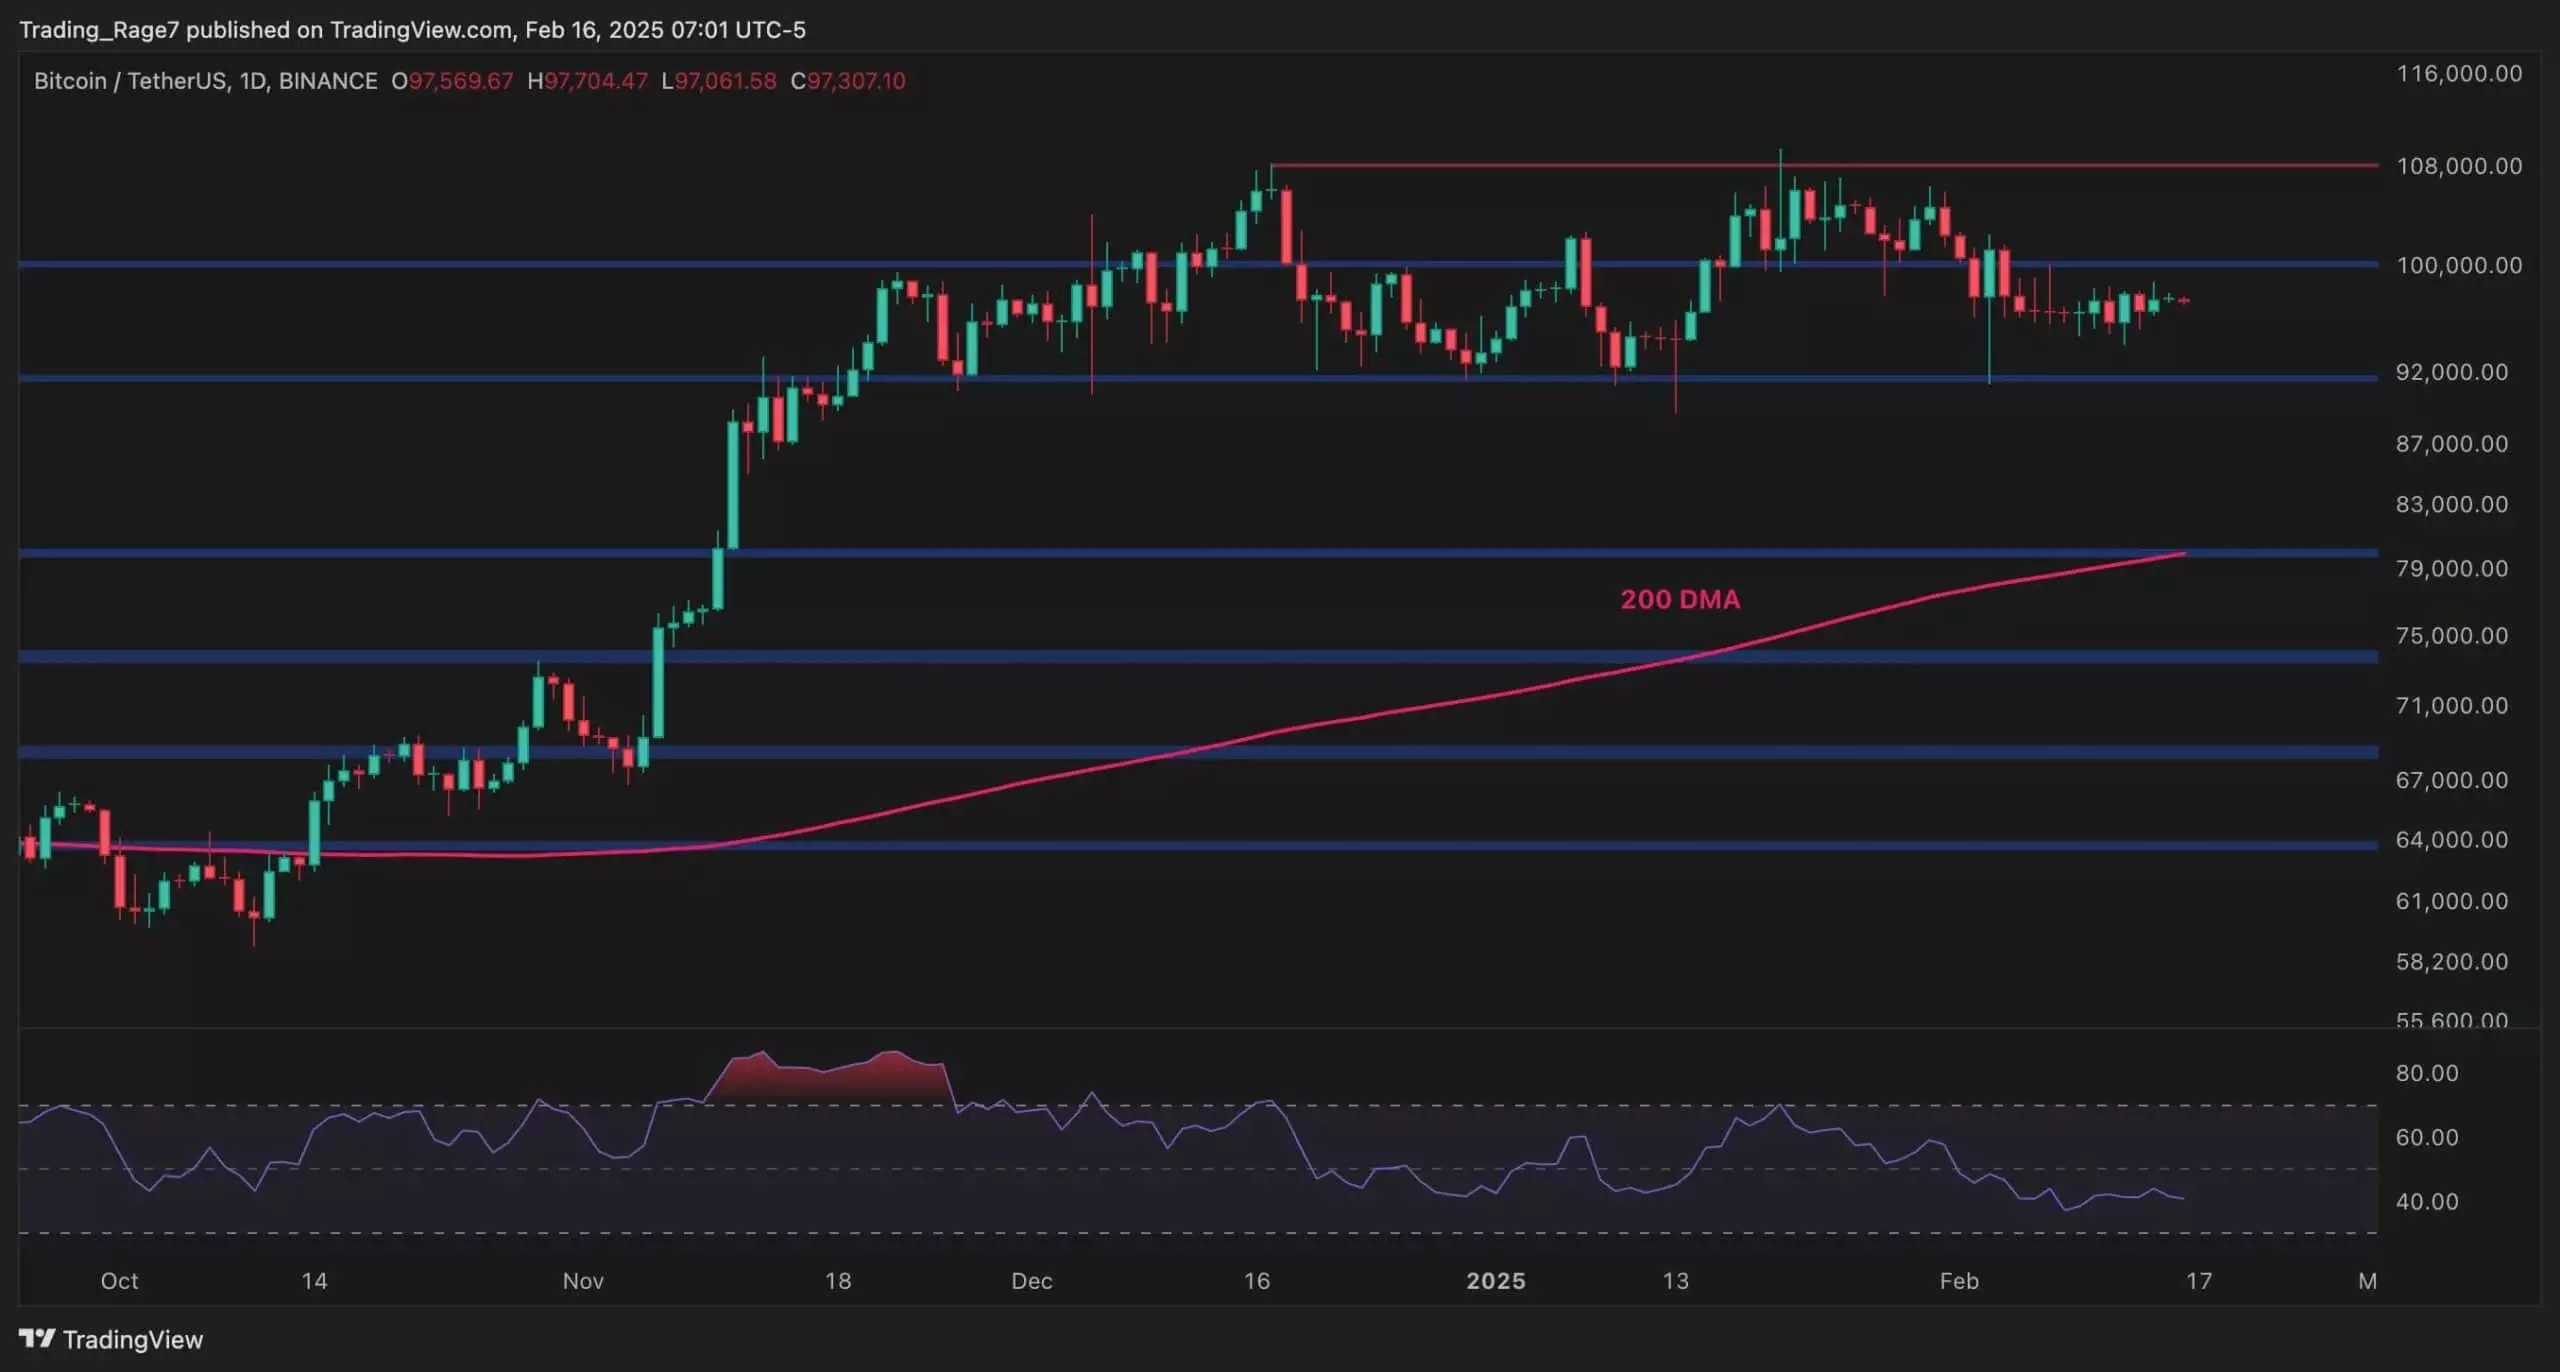
On the daily chart, Bitcoin’s price action illustrates a lack of momentum following its descent below the crucial $100,000 threshold. The asset has managed to find some support at the $92,000 mark while teetering above the pivotal 200-day moving average, positioned around $80,000. The Relative Strength Index (RSI), however, remains anchored below the 50% level, a clear signal of bearish momentum. This scenario raises concerns about the potential for further declines, especially as there exists a plausible path toward the $80,000 region before any optimistic bullish resurgence can be anticipated.
The 4-hour chart presents a more immediate outlook, showcasing a symmetrical triangle pattern forming as traders await a definitive breakout. At this juncture, the price appears poised to retest the lower boundary of this triangle, following a rejection from its upper limit. Coupled with the recent indicator drop on the RSI, the likelihood of a bearish movement intensifies. Should the triangle’s support yield to selling pressure, a downward shift toward the $92,000 area could be on the horizon, adding another layer of complexity to traders’ decision-making processes.
Market Sentiment: Accumulation vs. Distribution
The choppy nature of Bitcoin’s price movements reveals deeper shifts in market sentiment, necessitating a close examination of participant behavior regarding accumulation and distribution. The BTC exchange reserve metric provides insights into supply dynamics, tracking the volume of Bitcoin residing in exchange wallets. Traditionally, an uptick in this metric hints at rising selling pressure, as coins stored on exchanges can be liquidated swiftly.
Recent trends indicate a rapid decline in exchange reserves over the past weeks, signaling a potential buildup of purchasing interest among holders. However, a recent spike in reserves could stem from market uncertainty, showcasing traders’ hesitance to commit to a price rally in the immediate future. If this trend persists, it could lead to further downward pressure on Bitcoin’s price, marking a challenging period for both investors and analysts alike.
Bitcoin’s market landscape is characterized by confusion and indecision, with significant implications for its near-term trajectory. The technical indicators suggest a potential retest of lower levels, while the exchange reserve shifts reflect an environment of uncertainty among market participants. For traders, remaining vigilant and adaptable amidst these fluctuating conditions is paramount, as the landscape can change dramatically with new developments. As Bitcoin continues to navigate these unpredictable waters, informed strategies will be essential to weather the volatility ahead.
Leave a Reply