Ethereum is currently navigating a pivotal juncture in its market trajectory, characterized by critical chart patterns and significant liquidity zones that could shape its price action moving forward. Recent developments suggest that traders should remain vigilant, as the balance between bullish and bearish sentiments may lead to a pronounced price movement in the near future.
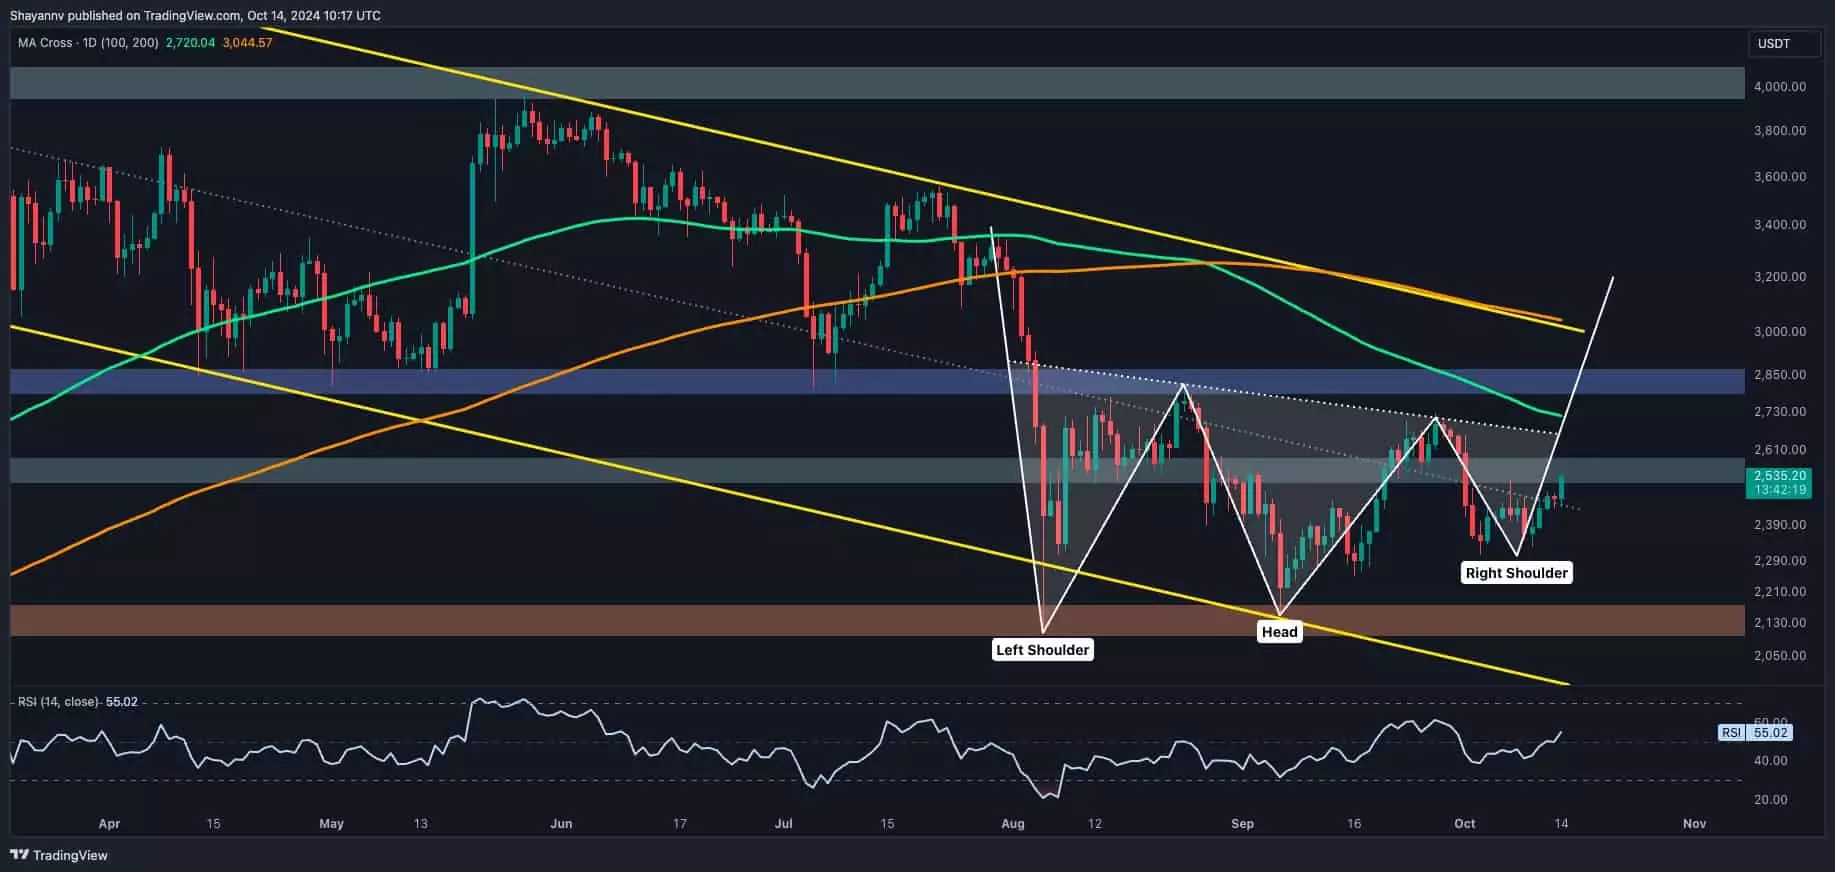
Analyzing the daily and 4-hour charts reveals the formation of key technical patterns. The emergence of an inverted head and shoulders formation near the pivotal $2.1K support level suggests a potential bullish reversal could be on the horizon. This is particularly relevant as this pattern typically indicates that selling pressure may start to fade and buyers are gaining control. Should Ethereum manage to break the neckline resistance located around $2.7K, it could catalyze a bullish movement targeting the upper resistance area near $3K.
Additionally, the 4-hour chart showcases a double-bottom pattern, hinting at a short-term bullish reversal. This pattern is often seen as a counterpoint to ongoing downtrends and can reflect a shift in momentum. The price oscillates between the support provided by an ascending flag pattern, positioned at around $2.3K, and a defined resistance area anchored by Fibonacci levels at $2.6K and $2.8K. Here, Ethereum is consolidating within a narrow range, which often serves as a precursor to a more significant breakout in either direction.
As Ethereum finds itself trapped in a price channel between $2.1K and $2.7K, identifying key support and resistance levels becomes crucial for traders and investors. The $2.1K level has shown resilience, representing a strong floor where buyers have previously stepped in to defend against downward breakouts. Conversely, the $2.7K level acts as an important psychological barrier; breaking above it could signal a powerful shift in market dynamics.
In the context of recent trading behavior, Ethereum’s struggle at these levels underscores the ongoing battle between buyers and sellers. Should the price breach these key levels, either upwards or downwards, it could trigger a cascade of reactions including stop-loss activations, resulting in accelerated price movements that affect broader market sentiment.
Understanding the liquidity landscape is essential in this current market phase. The Binance liquidation heatmap reveals significant concentrations of stop-loss orders and liquidation points, particularly in key areas surrounding $2K and $2.8K. Large market participants—often referred to as ‘whales’—hold substantial positions in these zones, heavily influencing price dynamics.
On the downside, the $2K region is particularly defended by institutional players, who have piled in with liquidity, creating a strong safety net should the price approach this threshold. This setup suggests that any drop towards this area may encounter intense buying pressure, which may prevent a significant breakdown. Conversely, the liquidity at $2.8K represents a formidable wall of resistance, indicating that traders have placed their liquidation orders in anticipation of an upward breakout. This corresponds with broader trading strategies and market sentiment prevalent among larger players.
The Path Forward for Ethereum
Ethereum’s current market phase reflects both opportunities and risks. The presence of the inverted head and shoulders pattern and the double-bottom formation imply that there is potential for bullish movement, contingent upon successful breakouts from critical resistance levels. Meanwhile, the identified liquidity zones serve as both safety nets and hurdles, emphasizing the complex dynamics at play in the Ethereum market.
As traders prepare for forthcoming price actions, it is important to closely monitor these technical signals and liquidity concentrations. A decisive breakout above $2.7K could initiate a wave of bullish enthusiasm and lead into the $3K territory, while a slip below $2.1K might trigger panic and liquidity cascades, prompting a significant downturn. Ethereal market participants must stay alert to these signals as they navigate the ebb and flow of this dynamic cryptocurrency landscape.
Leave a Reply